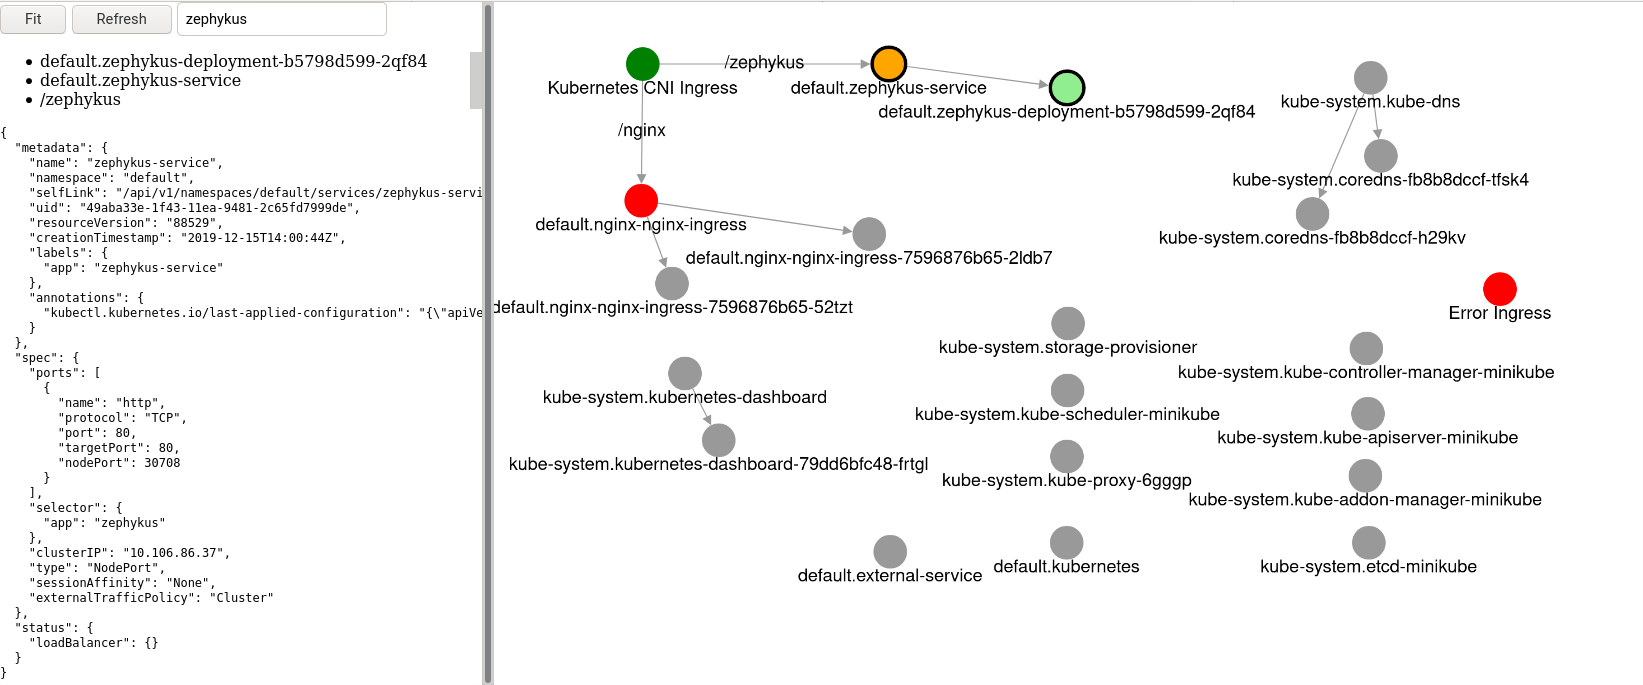
Graph visualization of Kubernetes Ingresses
Which issue does zephykus solve? For me, Kubernetes has eased the deployment of applications, however I have always struggled with visualizing the main kubernetes objects (Deployments, Pods, Service and Ingress). While there are tools out there like Weave Scope, I was looking for a tool suited to debug ingress rules. As it turns out, ingress configuration largely depend on the underlying CNI. Each implementation brings its own annotation that configure an ingress object additionally like path rewritting, backend protocol and many more....