Which issue does zephykus solve?
For me, Kubernetes has eased the deployment of applications, however I have always struggled with visualizing the main kubernetes objects (Deployments, Pods, Service and Ingress). While there are tools out there like Weave Scope, I was looking for a tool suited to debug ingress rules.
As it turns out, ingress configuration largely depend on the underlying CNI. Each implementation brings its own annotation that configure an ingress object additionally like path rewritting, backend protocol and many more. As the complexity grew as the cluster and the amount of namespaces grew, a visualization became a need to get an overview and quickly debug the configuration. The outcome is zephykus.
What is zephykus?

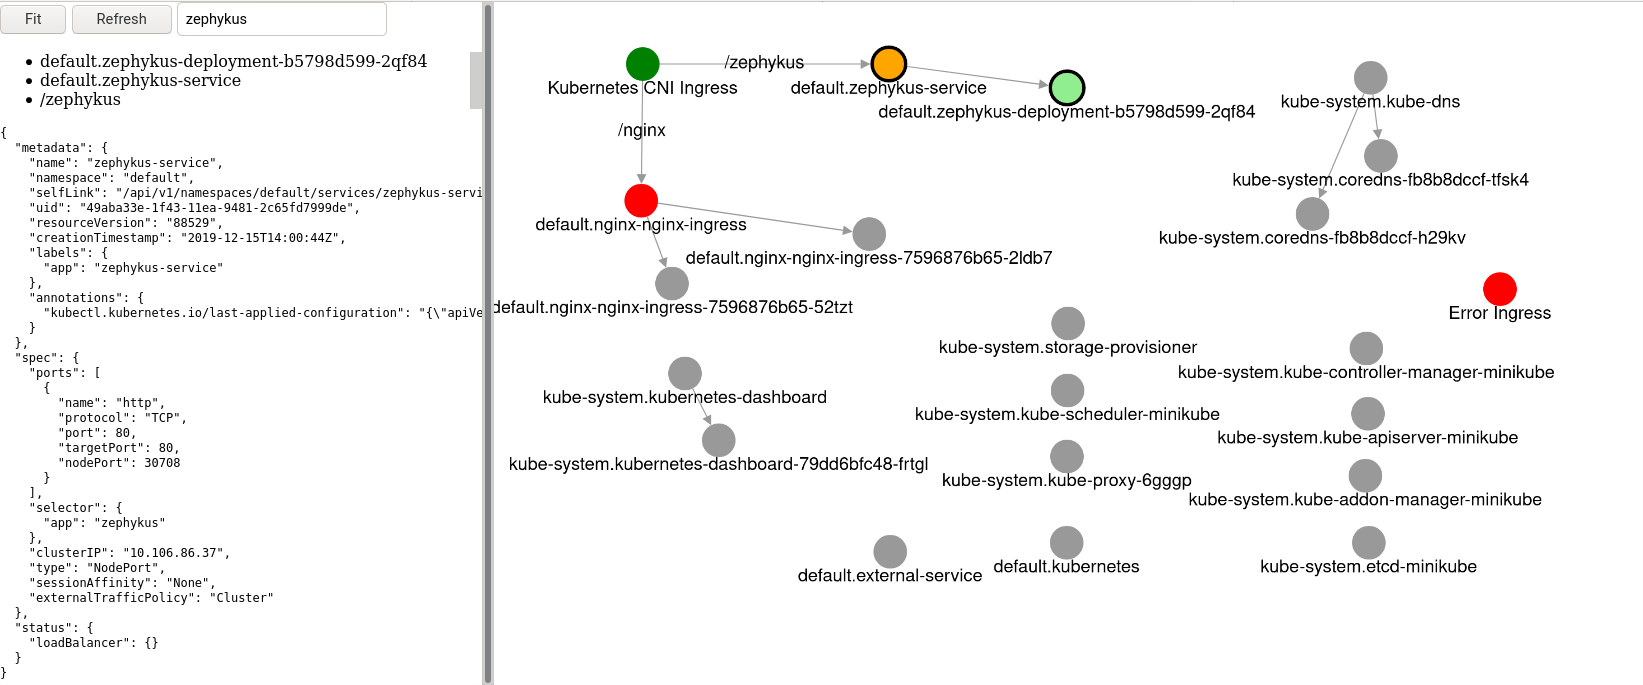
Zephykus is a graph based visualization of the kubernetes objects of type Ingress, Service and Pods (implicitly created by Deployments, ReplicaSets, StatefulSets).
When deployed into a namespace with kubectl apply -f https://raw.githubusercontent.com/timonback/zephykus/master/zephykus.yaml, it starts reading kubernetes configuration from kube-apiserver and provides the info to the frontend. While the zephykus.yaml contains configuration to serve the frontend directly via an Ingress rule as well as through a NodePort configuration, the frontend can be exposed locally via kubectl -n default port-forward svc/zephykus-service 3000:80 on http://localhost:3000/.
The project documentation offers some info about how to interpret the coloring, but usage is quite intuitive. The graph shows all kubernetes objects, each resource node as well as edge is clickable and exposes the raw info on the left hand side. The search box helps finding specific resource entities.
Demo
Either deploy it directly in your testing cluster or spin up a minikube environment. Alternatively, you can use katacoda. Go to the last tutorial page, apply the zephykus.yaml file, wait till the container is “Running” (kubectl get pods), find the http service port (kubectl get svc|grep zephykus) and navigate via the “view UI” to display the web-ui using the previously found port.
How is is build?
The server is a simple golang application using the client-go library. The frontend is a simple plain typescript application using cytograph for its graph visualization.
Feedback
Feedback is always welcome via email or pull-requests/issues on the project. I hope that the tool can be a help to you as well.